eveRyday
Tableau apps
Simple Dashboard
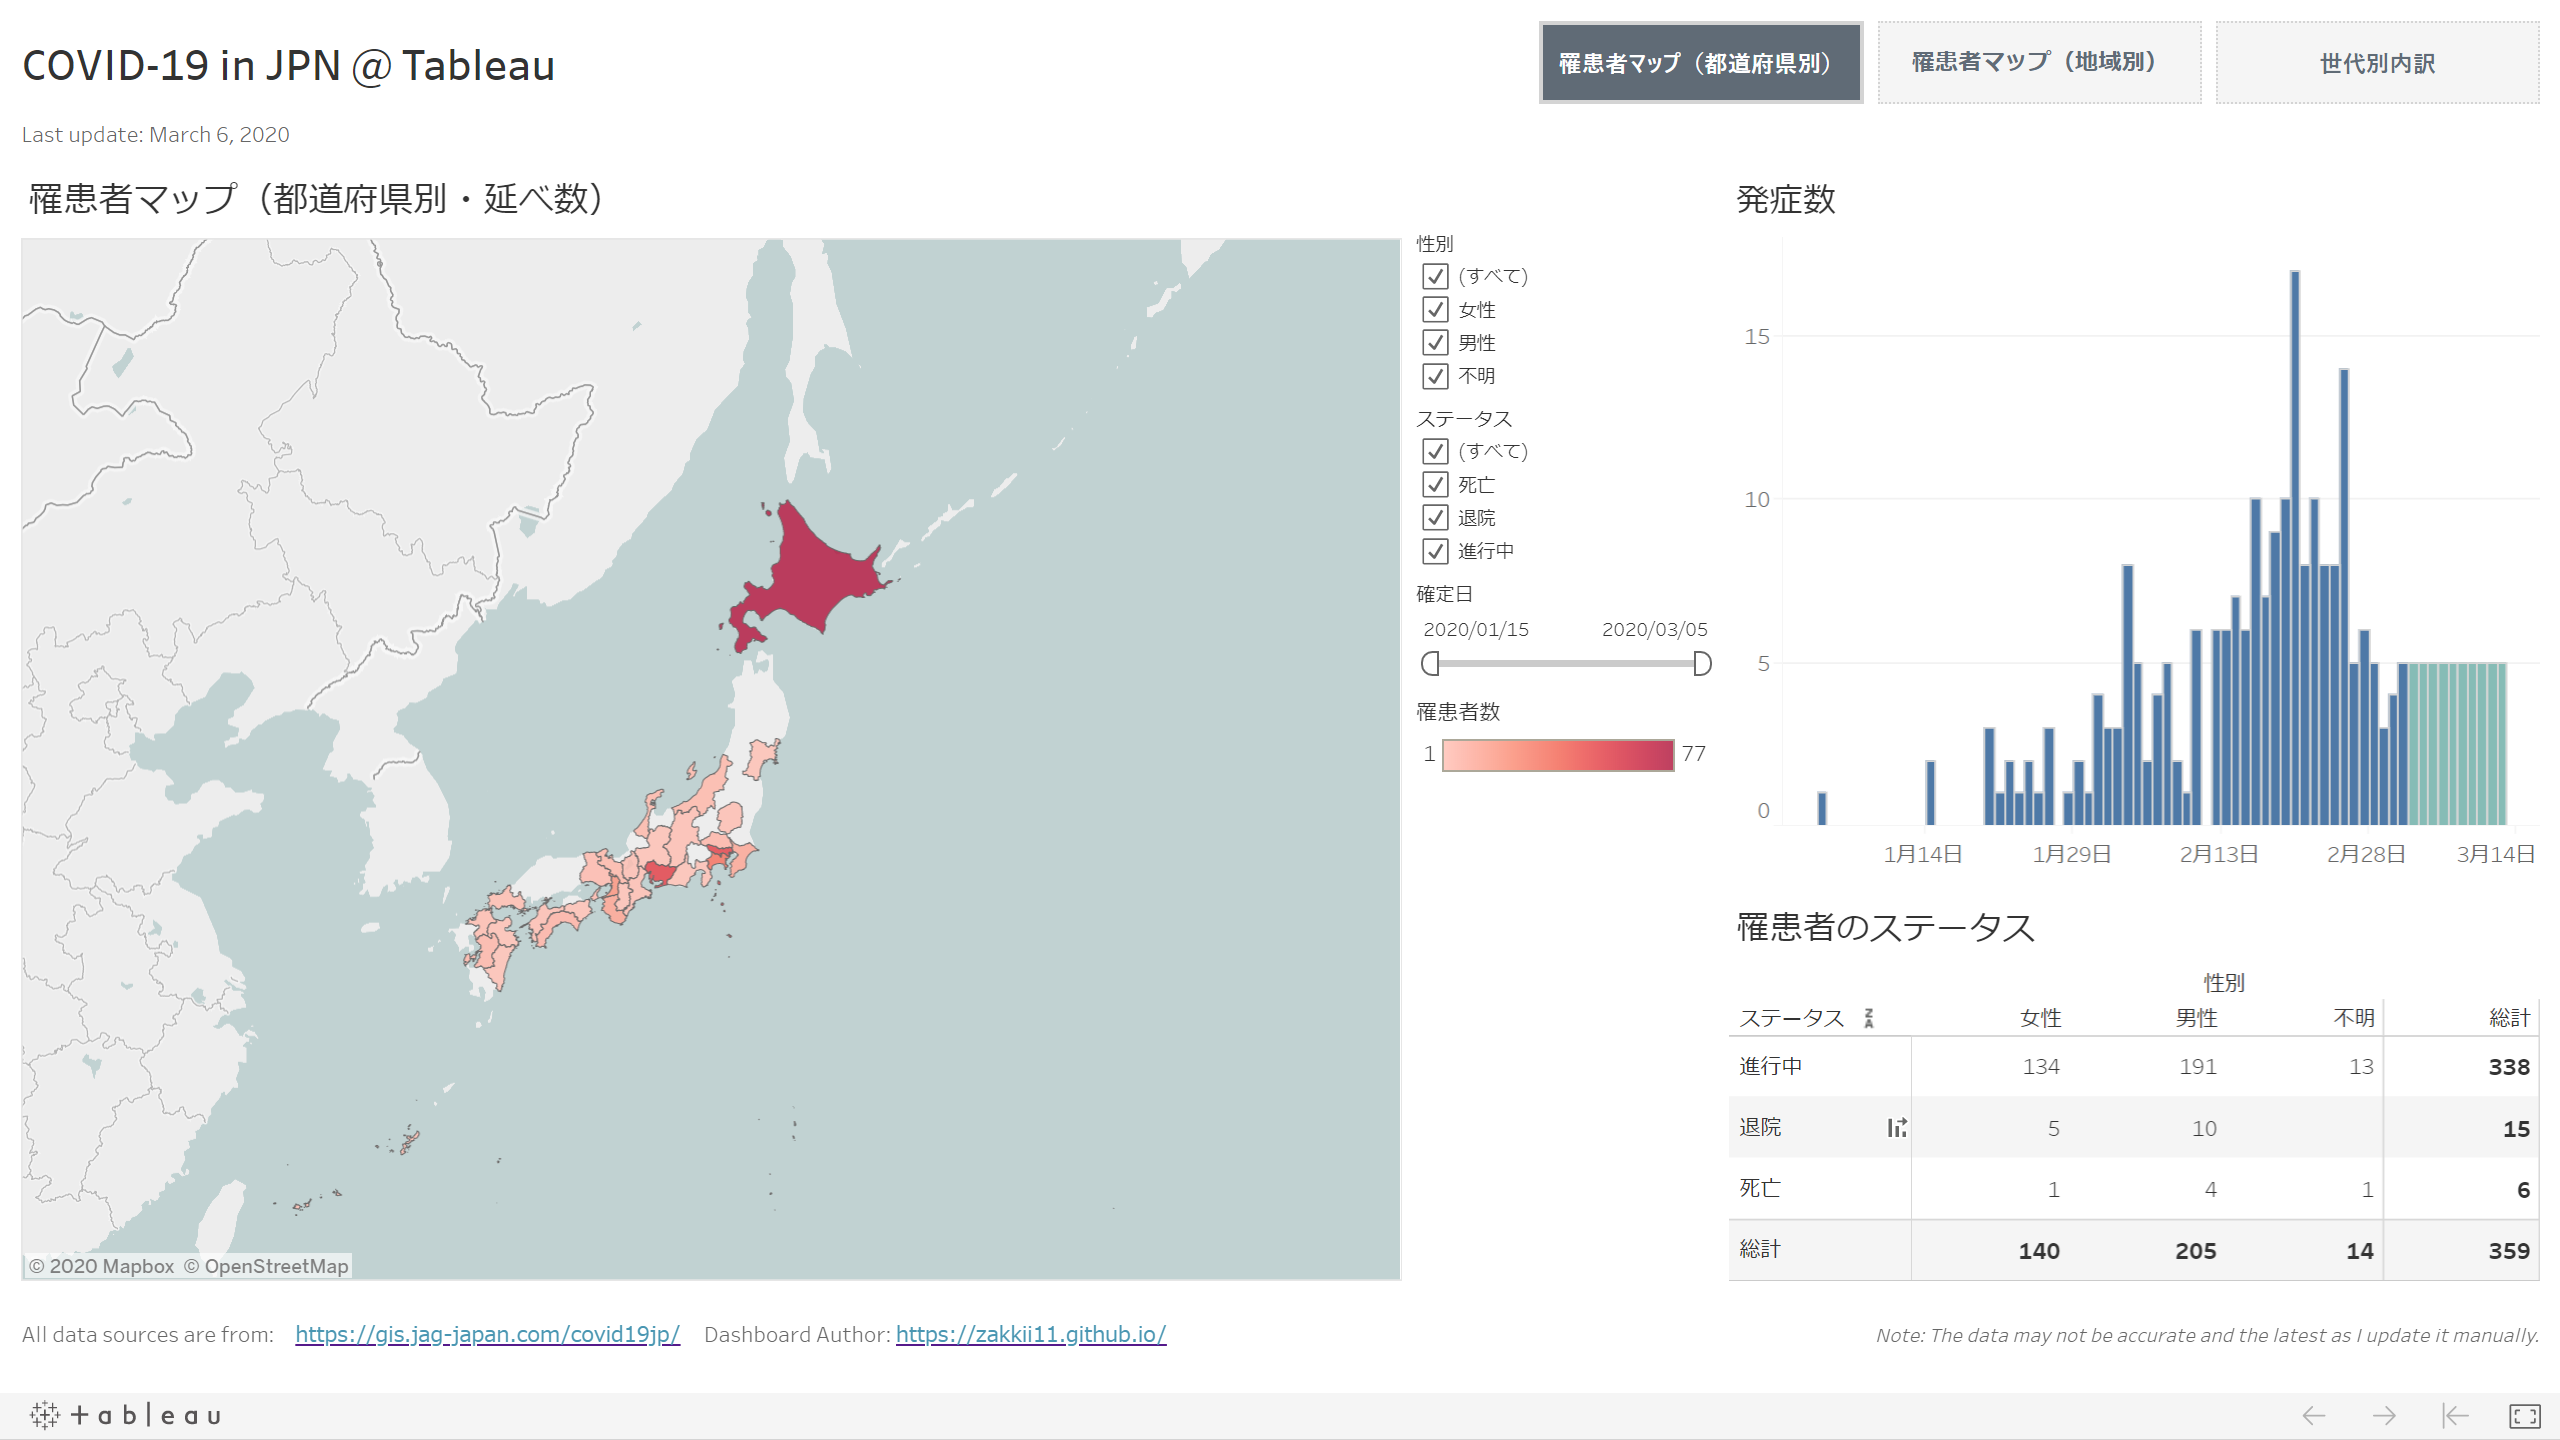
COVID-19 in JPN @ Tableau
The Dashboard visualizes the situation with COVID-19 in Japan in Simple UI. It will help you understand the present in easier and more intuitive ways.
For now, the dashboard is only available in Japanese.
Features
- Cases Mapping
- Plotted by the Prefecture or Municipalities of the residental area.
- Filter Function. (by sex, status, the date the infection confirmed on)
- Area-specific Information.
- Generational Breakdown
- The Change in the number of the new Cases.
- Status of the Cases.
- Active
- Dead
- Recovered
Data Source
The COVID-19 data used in the dashboard is retrieved from https://gis.jag-japan.com/covid19jp/, which also provides an integrated dashboard with a rich visual interface.